Abstract: Although many modern imaging systems are still
producing grayscale images, colored-images are more preferred for the larger
amount of information they are carrying. Computing the grayscale representation
of a color image is a straightforward task, while the inverse problem has no
objective solution. The search through out literature has not revealed much
history of the past works. In this paper, after a brief review of related
research, a new dimension-reduction method is proposed for natural color images
and approved by both quantitative (PSNR) and subjective tests. Based on it a
new class of colorizing methods is proposed and two sample formulations are
presented, where the authors are aware of many other formulations available.
Subjective test shows dominancy of our proposed method when our method is much
faster than others. Our method is leading in face image colorizing where other
methods have failed. Such colorization method can be used greatly in medical image
processing, surveillance systems, and information visualization.
Keywords: Image Colorizing, Principle Component Analysis
(PCA), Color Attributes
1 Introduction
Colored images are more preferred not only for their better visual appeal but also for the larger amount of information they are carrying.
Computing the grayscale representation of an image in hand is a trivial task, but when dealing with the inverse problem, the task shows itself a more complicated job, to be performed with some levels of human intervention.
Having in mind the enormous amount of classical heritage such as the first photograph, the lumiere brothers have taken or the early movies of Charles Chaplin, a user-friendly tool that converts the non-colored images to colored ones shows itself more useful. The commercial motivations towards such colorizing process are not less than humanistic ones. Even nowadays, many imaging systems are still producing the old-style grayscale (Many types of medical images) or green-scale (Infrared images [2]) images. Colorizing remote sensing images, medical images (Just for better illustration), surveillance images (For highlighting possible dangers as the baggage inspection performed in the airports), and weather images are just a few examples.
Authors have performed a widespread search in the literature containing personal contact to the authors of the very few papers found in the field. We have just found a few previous works in the field. Rather than the classic pseudocoloring task proposed by Gonzalez [4], the only noteworthy works are published by Welsh [1] and Yan [2].
In this paper, we call the
image to be colorized as the source image and the image from which the
color information is extracted as the mood image. In all formulas,
variables indexed by 1 belong to the source image where index 2 is deduced to
the mood image. Variables indexed by 1 with the prime symbol are those
relating to the source image after colorizing task takes place. All vectors in
this paper are column vectors.
After some consideration about information packing abilities of PCA, we propose a new category of colorizing methods that inputs both source and mood images in a segmented fashion. Then by principle component analysis and a little linear algebra work, it adds the color content of the mood image to the source image. To make a ground truth for comparing different algorithms, some conditions and measurements are proposed. Two sample formulas of the category are proposed and analyzed subjectively and quantitatively by means of PSNR.
2 Related Work
Colorizing
in its general meaning is assigning three-dimensional color information vectors
to one-dimensional luminance or brightness values, in order to satisfy some
subjective or quantitative goals. It is clear that there is no absolute
solution for this problem.
The simplest solution ever raised for the colorizing problem is pseducoloring first introduced by Gonzalez and Wintz [4] in which, 255 three-dimensional color vectors are enlisted in a color map and then applied to the source image by simple look up table processing. Of course, pseducoloring seems to be fully automated but the choice of a proper color-map needs human intervention. Although pseducoloring is an appropriate method for such tasks for which it was first purposed as highlighting explosives in the baggage inspection equipment at an airport, but the process that generates the color map for the general problem discussed here is yet another problem.
Welsh [1] uses ![]() color space, proposed
by Ruderman [5]. Ruderman’s aim was to minimize correlation between color
channels of natural scenes. After some considerations to gain a
device-independent color space, the work describes using principle component
analysis to compute maximal decorrelation between the three axes and proposes
the
color space, proposed
by Ruderman [5]. Ruderman’s aim was to minimize correlation between color
channels of natural scenes. After some considerations to gain a
device-independent color space, the work describes using principle component
analysis to compute maximal decorrelation between the three axes and proposes
the ![]() color space as a
result.
color space as a
result. ![]() is based on
data-driven human perception research that assumes the human visual system to
be ideally suited for processing natural scenes. Reinhard [3] expresses that
the
is based on
data-driven human perception research that assumes the human visual system to
be ideally suited for processing natural scenes. Reinhard [3] expresses that
the ![]() color space has never
been applied otherwise or compared to the other color spaces.
color space has never
been applied otherwise or compared to the other color spaces.
Welsh
states that the problem of transferring color information to a grayscale image
has no exact objective solution and that the goal in the field is reducing the
human labor required for the task. He chooses the ![]() color space and adds
color content (
color space and adds
color content (![]() information) to single l information present in the
source image. Rather than some extra neighborhood information processing, his
work generally assumes that the image is divided into distinct luminance
clusters where each region is covered by a distinct texture. In addition, he
assumes that similar material on the source and mood image are in the same
range of intensity. As he states in his paper, the method does not work very
well with the face images, as the
information) to single l information present in the
source image. Rather than some extra neighborhood information processing, his
work generally assumes that the image is divided into distinct luminance
clusters where each region is covered by a distinct texture. In addition, he
assumes that similar material on the source and mood image are in the same
range of intensity. As he states in his paper, the method does not work very
well with the face images, as the ![]() measure he has used is not always a sufficient measure in
classifying the difference between skin and lips. Although the method works
very slowly, (15 seconds to 4 minutes in a Pentium
measure he has used is not always a sufficient measure in
classifying the difference between skin and lips. Although the method works
very slowly, (15 seconds to 4 minutes in a Pentium
Yan
[2] has focused on colorizing infrared home videos. He states that all
commercial camcorders available in the market are equipped with a night shot
tool along with a still shot with flash. The work’s genius idea is the
use of the still imaging part of the camera as the mood-image acquiring tool.
As he expresses, amateur users of such cameras do not use professional
lightings and the flash of the cameras cannot function continuously because of
battery capacity considerations. The paper does not express his own colorizing
approach, but it seems that it’s main emphasize is applying Welsh’s work on
temporally distributed images. Of course, there are three colorized movies in
the Welsh’s site, having in mind that Welsh has reported his work to fail on
face images, were home video mainly consists of such scenes.
We
want to emphasize on the main shortcoming of both Welsh and Yan’s work. They
have considered that there is a one-by-one correspondence between grayscale information
and color vectors. As stated before this is the main idea in pseudocoloring,
and is not true in ordinary images were different parts of the image belong to
different materials.
3 Principle Component Analysis
The idea of reducing the
color space dimension is not a new idea; many researchers have reported
benefits of illumination coordinate rejection [6].
PCA (Principle Component Analysis) [7] is widely used in
signal processing, statistics, and neural networks. In some areas, it is called
the (discrete) Karhunen-Leove transform or the Hotelling transform.
The basic idea behind PCA
is to find the components ![]() so that they explain
the maximum amount of variance possible by
so that they explain
the maximum amount of variance possible by ![]() linearly transformed
components. By defining the direction of the first principal component, say
linearly transformed
components. By defining the direction of the first principal component, say![]() , by (1), PCA can be represented in an intuitive way.
, by (1), PCA can be represented in an intuitive way.
|
|
(1) |

Thus, the principal
component analysis is the projection of data on the direction in which the
variance of the projection is maximized. Having determined the first ![]() principal components,
principal components, ![]() is determined as the principal component of the residual as
in (2).
is determined as the principal component of the residual as
in (2).
|
|
(2) |

The principal components
are then given by![]() . In practice, the computation of
. In practice, the computation of ![]() can be simply accomplished using covariance matrix
can be simply accomplished using covariance matrix![]() . Now
. Now ![]() is the eigenvector of
is the eigenvector of ![]() corresponding to the nth
largest eigenvalue.
corresponding to the nth
largest eigenvalue.
The basic goal in PCA is to
reduce the dimension of data. Thus, one usually chooses![]() . Indeed, it can be proven that the representation given by
PCA is an optimal linear dimension reduction technique in the mean-square
sense. Such a reduction in dimension has important benefits. First, the
computational overhead of the subsequent processing stage is reduced. Second,
noise may be reduced, as the data not contained in the n first components may be
mostly due to noise.
. Indeed, it can be proven that the representation given by
PCA is an optimal linear dimension reduction technique in the mean-square
sense. Such a reduction in dimension has important benefits. First, the
computational overhead of the subsequent processing stage is reduced. Second,
noise may be reduced, as the data not contained in the n first components may be
mostly due to noise.
4 Proposed Algorithms
In this section after a brief concentration on the direct problem of converting a color vector to a grayscale value, our method for reverse problem is described.
4.1 Color to
Grayscale Transformation
Many measures of intensity have been proposed in the
literature with different meanings and reasons, and no one has been
standardized generally (For a few examples look at [8], [9], and [10]). A few
samples are listed in Table 1. For generalization, we call such measure the achromatic
norm or easily the norm.
To use linear algebra methods we limit our work to
linear norm functions generally shown as ![]() as described in (3) where the vector
as described in (3) where the vector ![]() is a posterior defined satisfying the condition
is a posterior defined satisfying the condition![]() .
.
Table 1. Few examples of
different intensity components
|
Color space |
Intensity component |
|
|
|
|
|
|
|
|
|
|
|
|
|
|
|
|
|
(3) |
The above-defined norm function satisfies two simple
but important conditions, Stated in (4) and (5). The proofs are easily obtained
by definitions and a little linear algebra work.
|
|
(4) |
|
|
(5) |
4.2 Proposed
Colorizing Methods
Our general view to the
colorizing problem is illustrated in figure 1 as a user-guided process of liquefying
the color content of a given image (the mood image) and purring it onto a
grayscale image (the source image).
As the transformation from
a 3-D color vector to a single intensity number is not reversible, so there
could be many extremely different colors with the same appearance in the
grayscale image. One method to distinguish such fake points is to use some
neighborhood information as Welsh has worked out. His method is based on a
suspicious assumption that color regions of the same material are in the same
range of intensity. Having in mind the desperate performance he has reported,
along with the wide range of images in which the method fails, containing the
major category of face images, the need for a completely different method
arises.
Figure 1: General idea behind
colorizing as a user-guided process of liquefying the color content of a given
image and purring it onto a grayscale image.
To withdraw the
shortcomings of Welsh’s work, we separated the color extraction and
segmentation phases. Rather than Welsh’s work that combined the two
segmentation phases for the mood and the source image that are entirely
different (one working on a color image whilst the other one is essentially
working on grayscale images), We assumed that regarding to the problem in hand
the source image has been separated into a few segments describing the content
of the points in the physical phenomenon. Such segmentation could be the result
of an entirely different pre-processing widely discussed in the literature.
Each segment is responsible for a distinct region, for example Wood and Leaf in
the image under process in Figure 1. Segmentation of the mood image is much
easier because user must only highlight middle-sized rectangular areas of each
predefined color mood. For generality, we have assumed that both the mood image
and the source image are segmented completely.
When the regions in the
mood image were highlighted, the color content must be extracted. In our work,
we suggest using PCA for that job. When an area in the image is said to be the
representative of i-th region, the two parameters ![]() and
and ![]() are computed as the
mathematical expectation of the color information of the region and the eigenvector
of the covariance matrix of the color information of the region corresponding
to the largest eigenvalue respectively (The direction of the first principle
component).
are computed as the
mathematical expectation of the color information of the region and the eigenvector
of the covariance matrix of the color information of the region corresponding
to the largest eigenvalue respectively (The direction of the first principle
component).
The selected region then
can be represented by a one-dimensional representation in contrast with the
ordinary three-dimensional representations, with the aid of the above-described
statistical parameters, as the vector ![]() is represented by the vector
is represented by the vector ![]() in (6). Note that the
in (6). Note that the ![]() space is now a shifted
version of a one-dimensional vector space.
space is now a shifted
version of a one-dimensional vector space.
|
|
(6) |
A test was planned in order
to investigate the amount of data lost in this operation. Eight homogenous
regions in standard sample images were considered, then the PSNR of the
reconstructed image ![]() was computed as (7)
along with a new parameter
was computed as (7)
along with a new parameter ![]() defined to show the ratio of information available in a given
channel X belonging to
defined to show the ratio of information available in a given
channel X belonging to ![]() as described in (7). As the transformation from
as described in (7). As the transformation from ![]() . The Complete results
are shown in the results part of the paper.
. The Complete results
are shown in the results part of the paper.
The high PSNR (32 averagely with standard deviation of less than four) shows that such dimension reduction is objectively considerable.
There is no objective parameter proposed for comparing
different colorizing tasks in the literature, but some conditions and measures
seem to be appropriate. We propose three conditions to be met by a perfect
colorizing process, as![]() ,
, ![]() , and
, and![]() .
.
The first condition states that converting the colorized source image back to grayscale representation should revert it. The second condition along with the third one tries to ensure that the same color information, which was extracted from the mood image, is available in the source image after colorization takes place.
|
|
(7) |
Two quantitative measures that could be defined to compare different colorizing tasks are the algorithm speed and human sense. Algorithm speed can be described as the color extraction price and operation per pixel complexity. Human sense could be measured by means of impairment (Table 2) and goodness (Table 3) scales [11].
Table2. Impairment scales [11]
|
1 |
Not noticeable |
|
2 |
Just noticeable |
|
3 |
Definitely noticeable but
only slight impairments |
|
4 |
Impairment not
objectionable |
|
5 |
Somewhat objectionable |
|
6 |
Definitely objectionable |
|
7 |
Extremely objectionable |
Table3. Goodness scales
|
5 |
Excellent |
|
4 |
Good |
|
3 |
Fair |
|
2 |
Poor |
|
1 |
Unsatisfactory |
We propose a new category of colorizing methods, which
reconstruct the color information by a function of ![]() generally stated as (8), satisfying the three
conditions.
generally stated as (8), satisfying the three
conditions.
|
|
(8) |
Many different formulations were worked out and applied
by the authors, two formulations that seemed to be more appropriate are
proposed in (9) and (10), Where in both ![]() is assumed unity.
Authors are aware of huge number of such formulations. To show the versatility
of the category, two other formulations are stated in (11) and (12), in which
user can tune the parameter
is assumed unity.
Authors are aware of huge number of such formulations. To show the versatility
of the category, two other formulations are stated in (11) and (12), in which
user can tune the parameter![]() , to control the amount of color added to the image (
, to control the amount of color added to the image (![]() adds no color to the source image resulting in the same
grayscale image). (11) And (12) are not discussed in this paper. Considering
the two samples (9) and (10) the entire category can be estimated.
adds no color to the source image resulting in the same
grayscale image). (11) And (12) are not discussed in this paper. Considering
the two samples (9) and (10) the entire category can be estimated.
|
|
(9) |
|
|
(10) |
|
|
(11) |
|
|
(12) |
As ![]() is considered unity, it is easy to see that in both (9)
and (10),
is considered unity, it is easy to see that in both (9)
and (10), ![]() , fulfilling the first condition. In addition, as
, fulfilling the first condition. In addition, as ![]() is equal to zero, it is convenient that in (10),
is equal to zero, it is convenient that in (10), ![]() complying with the second condition in contrast with (9) that
does not comply (
complying with the second condition in contrast with (9) that
does not comply (![]() ). It can be proved that the third condition is valid
in both (9) and (10) as expressed in (13).
). It can be proved that the third condition is valid
in both (9) and (10) as expressed in (13).
|
|
(13) |
Both (9) and (10) cost three subtractions, three additions and three multiplications for each pixel in colorization phase.
To test the proposed colorizing methods, attempts were made to colorize sample images of Welsh paper with our two proposed methods, and a subjective test was applied to the results. Twenty-six girls and boys of age 17 to 27 were asked to reorder the three images (Welsh’s synthesized image and the result of (9) and (10)) in terms of goodness. The subjects were unaware of the algorithms but were literate people. Neither the source image nor the mood image was exposed to the subjects, but they were able to scroll in the monitor in order to watch any of the three images at any time they wanted. The images were shown in a randomly ordered fashion and no timing threshold was set. The answers were given as strings containing 1,2,3 along with the comma and slash. For example, 1/2,3 was defined to mean, first image is the best, and second and third are the same in the next place. Subjects were not allowed to contribute the results. When the subjects performed the ordering task, the orders were changed to scores (0..3) and statistical analysis was preformed on them. Results are shown in the result section.
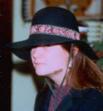
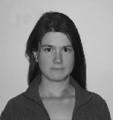
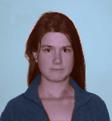
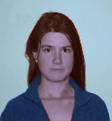
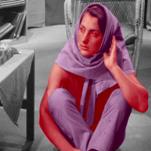
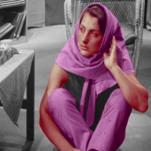
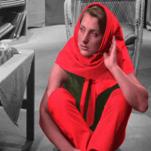
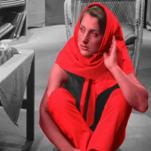
To test the algorithm in special problem of face colorizing, three standard images (Lena, Girl and Barbara) were selected and were manually segmented into six distinct segments of skin, hair, lip, cloth1, cloth2 and don’t care (Background). The claim was that our algorithm satisfies the user when preformed on face images, when Welsh has reported his method to fail in this field. Segmented images are shown in Figure 2.
|
(a) |
(b) |
(c) |


Figure 2: Segmented version of test images for face
colorizing, a: Girl, b:
The grayscale version of the three images were colorized
twelve times, once with the color information of
A subjective test was performed on the results,
containing two questions of Impairment and goodness. Of course, as the
background was leaved grayscale in all synthetic images, the background of the
original image was made grayscale too. To find out the quality of the method
dealing with the special problem of face colorizing, both questions were asked
twice, once for the entire image and then only for the face area. As the color
version of Barbara was not available, only the goodness question was asked. In
addition, PSNR analysis was performed on
5 Dataset
Standard images were used for both the homogenous region
reconstruction test and the face-colorizing test. The standard images in region
reconstruction were Baboon, Lena (Full version), Girl, and Peppers; the test
images in face reconstruction part were
6 Results
Eight swatches were used in
dimension reduction test are shown in Figure 3, one-dimensional version images
are shown in Figure 4. Numerical results are printed in Table 4.
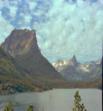
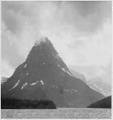
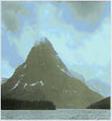
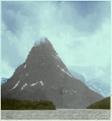
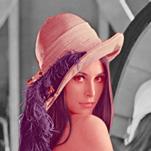
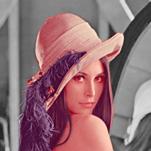
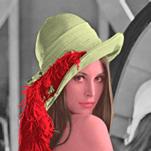
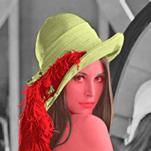
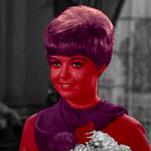
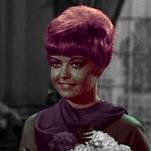
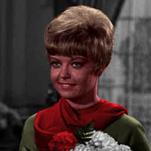
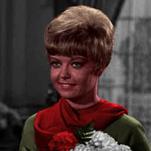
Two samples of Welsh are shown in figure 5, along with the colorized images by (9) and (10).
The algorithms were developed in Matlab 6.5 with highly optimized code, on an 1100 MHZ Pentium III personal computer with 256MB of RAM. For a 256*256 image containing eight regions, the color extraction phase was performed in 2 seconds averagely, when the color transfer phase got another 2 seconds
|
(a) |
(b) |
(c) |
(d) |
|
(e) |
(f) |
(g) |
(h) |


Figure 3: eight homogenous regions in standard images
selected to estimate proposed dimension reduction method. a: Nose of Baboon, b:
Wool of Baboon, c: Lateral part in nose of Baboon, d: Hair of Girl, e: Skin of
|
(a) |
(b) |
(c) |
(d) |
|
(e) |
(f) |
(g) |
(h) |


Figure 4: Results of dimension reduction process on samples of fig. 4 (Images are not proportionally resized)
Table 4. Statistical parameters of dimension reduction applied on sample images
|
|
a |
b |
c |
d |
e |
f |
g |
h |
|
|
|
|
25 |
30 |
30 |
35 |
38 |
34 |
33 |
28 |
32 |
4 |
|
|
52 |
58 |
79 |
65 |
63 |
21 |
68 |
42 |
56 |
17 |
|
|
44 |
62 |
46 |
57 |
55 |
71 |
54 |
65 |
57 |
9 |
|
|
72 |
52 |
38 |
48 |
53 |
66 |
49 |
63 |
55 |
10 |
|
|
84 |
97 |
89 |
99 |
97 |
98 |
88 |
94 |
93 |
5 |
|
|
51 |
18 |
44 |
10 |
22 |
18 |
44 |
27 |
29 |
14 |
|
|
13 |
7 |
7 |
3 |
4 |
7 |
13 |
18 |
9 |
5 |
The
subjective test on Welsh samples gave the following results. When the average
score for Welsh’s algorithm was 1.833, (9) was given 2.119, and (10) was given
2.429, making the average score for our methods about 2.27 (all out of 3).
Colorized version of
Table 5. PSNR values for
|
Mood |
|
Girl |
||
|
Source |
(6) |
(7) |
(6) |
(7) |
|
|
26 |
26 |
18 |
21 |
|
Girl |
14 |
13 |
28 |
28 |
Table 6. Subjective Results of face colorizing tests.
|
|
|
Image |
Face |
||
|
|
|
I[1] |
G[2] |
I |
G |
|
S=M[3] |
(9) |
67 |
75 |
82 |
90 |
|
(10) |
75 |
87 |
88 |
98 |
|
|
S<>M[4] |
(9) |
35 |
72 |
45 |
80 |
|
(10) |
40 |
83 |
52 |
96 |
|
|
No S[5] |
(9) |
|
60 |
|
80 |
|
(10) |
|
78 |
|
95 |
|
7 Discussion
It is clear in Table 4 that in contrast with ![]() of around 50, in PCA channels the information mostly gathers
in the first channel (90 compared with 30 and 10).
of around 50, in PCA channels the information mostly gathers
in the first channel (90 compared with 30 and 10).
Comparison of ![]() in the first and the fourth samples (the extreme values of
in the first and the fourth samples (the extreme values of![]() ) are valuable. While shades in the nostrils of the Baboon,
distributes the information in the three channels of PCA, the information
densely focuses in PC1 channel in the hair sample. This means scattered images
do not give bad results for sure. In addition, it must be emphasized that skin
sample has gained
) are valuable. While shades in the nostrils of the Baboon,
distributes the information in the three channels of PCA, the information
densely focuses in PC1 channel in the hair sample. This means scattered images
do not give bad results for sure. In addition, it must be emphasized that skin
sample has gained ![]() of 97, so face components (d and e) tend to respond to such
dimension reduction averagely better.
of 97, so face components (d and e) tend to respond to such
dimension reduction averagely better.
The average PSNR of 32 in table 4 shows that the proposed dimension reduction process is a reasonable reconstruction scheme. The low standard deviation (four) between different PSNR values proves the method to respond uniformly. The highest PSNR has been gained in the fifth sample, the skin. This is why we are concentrating on face images, containing big areas of skin. The worst result is obtained in the first sample because of the dark shades of the nostrils.
As Welsh uses the luminance as the segmentation criteria, his method is completely depending on the similarity of the source and mood images. Such dependency does not exist in our work. Using the intensity as the matching feature sometimes makes an odd artifact in Welsh’s synthesized images as a discontinuity of color appearance. Such effect could be easily recognized in the background of samples shown in figure 5 (5-c, 5-h).
Our methods perform PCA for each sample; in contrast with
Welsh’s work that is based on the ![]() color space, that has
performed PCA on a set of sample images once. Theoretically, we are working on
a better base of uncorrelatedness.
color space, that has
performed PCA on a set of sample images once. Theoretically, we are working on
a better base of uncorrelatedness.
The three conditions defined in the method section try to
build a ground truth for new algorithms. Our first method, justifies only two
of the methods, where our second proposed method justifies all. Welsh’s method
holds the first condition, as he just transfers ![]() components, leaving the
components, leaving the ![]() value unchanged, but
he has given no attention on the other two conditions. It must be emphasized
that the
value unchanged, but
he has given no attention on the other two conditions. It must be emphasized
that the ![]() component of
component of ![]() is not a linear norm
function.
is not a linear norm
function.
Our method works about 20 times faster (Our 4 seconds measurement, versus 15 seconds to 4 minutes record of Welsh in similar systems), though he offers to use larger window sizes. Considering the speed of algorithms, our algorithm is dominant.
Our methods were recognized subjectively, 16% and 32% better respectively than Welsh were, resulting in 24% better score averagely. Our second proposed method was about 15% better than our first method.
Table 5 shows that both methods are similar in PSNR sense. It is clear that colorizing each image by its color information gives better results, though the meaning of PSNR test must be considered carefully. Many objectionable images with high values of PSNR can be produced.
In face images, our methods were approximately scored 83 out of 100, which means the synthetic images are averagely thought good. In impairment scales, the colorized images were considered not objectionable (60.5 out of 100). Face region is averaged 23% higher than the whole colorized area, when method (10) has gained 18% more scores than (9). Also it must be emphasized that colorizing with the same color content of the source image gives better results, but not much better (less than 6%), the same fact rules in the scores given to the case of comparing S<>M (Refer to footnote of previous page) with No S case.
8 Conclusion
A
new dimension-reduction method was proposed that maps the three-dimensional
vector space of color information to a shifted one-dimensional vector space.
The transform was approved by both quantitative (PSNR) and subjective tests.
Based on the dimension-reduction method a new class of colorizing methods was
proposed and two samples were considered, where there are many other
formulations available. Subjective test shows dominancy of our proposed method
whilst our method is twenty times faster. As Welsh has reported his method to
fail in face-image colorizing, a test was performed on standard face images and
was shown to be leading both regarding to quantitative tests and subjective
tests. Conditions and measurements were proposed for comparison of future
colorizing methods.
References
[1] Tomihisa Welsh, Michael Ashikhmin and Klaus Mueller, “Transferring Color to Grayscale Images”, proceedings of ACM SIGGRAPH 2002, San Antonio, pp. 277-280, July 2002
[2]
Wei-Qi Yan, Mohan S Kankanhalli, “Colorizing Infrared Home Videos” , IEEE, 2003
[3]
Erik Reinhard, Michael Ashikhmin, Bruce Gooch, and Peter Shirley, “Color
Transfer between Images”, IEEE Computer Graphics and Applications,
September/October 2001, pp. 34-41
[4] Gonzalez R.C. and Wintz P., “Digital Image Processing”, Addison-Wesley Publications, 1987
[5] D.L. Ruderman, T.W. Cronin, and C.C. Chiao,”
Statistics of Cone Response to Natural Images: Implications for Visual Coding”,
J. Optical Soc. Of
[6]
Min C. Shin, Kyong I. Chang, Leonid V. Tsap, “Does color space transformation
make any difference on skin detection?”, http://citeseer.nj.nec.com/542214.html
[7]
Aapo Hyvarinen, “Independent Component Analysis: Algorithms and Applications”,
IEEE transaction on Neural Networks, April 1999
[8]
Smith A. R., “Color Gamut Transform pairs”, Computer Graphics 12, August 1978
[9] T-Y Shin, “The reversibility of six geometric color spaces”, Photogrammetric Engineering and Remote Sensing, October 1995
[10]
Y. I. Ohta, Y. Kanade and T. Saki, “Color information for region segmentation”,
Computer graphics and image processing, July 1980
[11] Anil K. Jain, “Fundamentals of Digital Image Processing”, Prentice-Hall International, Inc., 1989