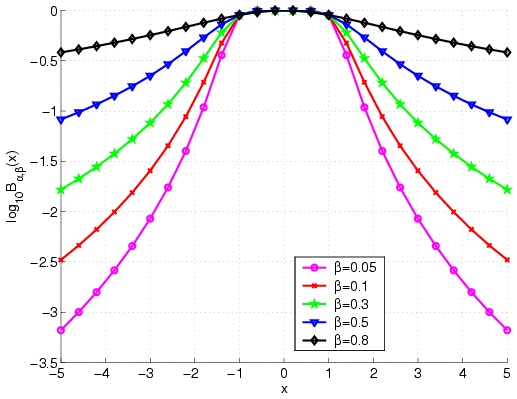
 |
| (1) |
| (2) |
| (3) |
| (4) |
| (5) |
| (6) |
| (7) |
| (8) |
| (9) |
| (10) |
| (11) |
| (12) |
| |
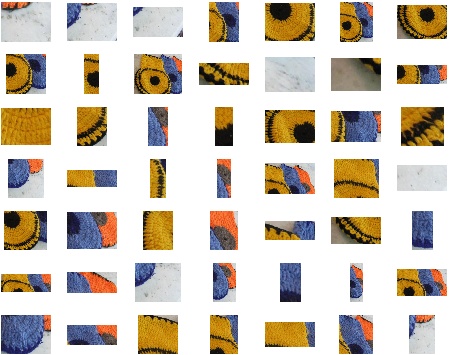
 |  |  |  |
| (a) | (b) | (c) | (d) |
 |  |  |  |
| (e) | (f) | (g) | (h) |
 |  |  |  |
| (i) | (j) | (k) | (l) |
 |  |  |  |
| (m) | (n) | (o) | (p) |
 |  |  |  |
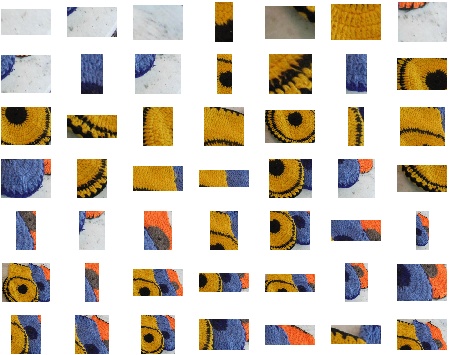
| (a) | (b) | (c) | (d) |
 |  |  |  |
| (e) | (f) | (g) | (h) |
 | ||
| (a) | ||
 |  |  |
 |  |  |
 |  |  |
| (b) | ||
 |  |  |
 |  |  |
 |  |  |
| (c) | ||
 |  |  |
 |  |  |
 |  |  |
| (d) | ||
 |
 |
| (a) |
 |
| (b) |
 |
| (c) |