Approximation Algorithms For Maximizing The Information-Theoretic Sum Capacity of Reverse Link CDMA Systems

Approximation Algorithms For Maximizing The Information-Theoretic Sum Capacity of Reverse Link CDMA Systems

Arash Abadpour, Attahiru Sule Alfa, Anthony C.K. Soong

Abstract

Since the introduction of multimedia services to CDMA systems, many researchers have been working on the maximization of the aggregate capacity of the reverse link. This problem looks for the optimal set of transmission powers of the stations subject to a set of constraints. One of the research directions in this field is to devise a practically realistic set of constraints and then to propose an algorithm for solving the resulting problem. Through a unified approach, introduced recently by the authors, a more general investigation of the problem, equipped with a wide range of constraints, is possible. Here, we go further and propose an approximation to reshape the objective function into a more conveniently workable one. Then, we analyze the three available formulations of the problem and show that integrating this approximation into the available algorithms has the benefit of reducing the computational cost. The paper includes the mathematics involved in the approximation and its integration into the algorithms. Also, we analyze examples to demonstrate the achievements of the proposed method.
Quality of Service, Single Cell, Reverse Link CDMA, Optimization, Approximation.

1  Introduction

Analysis of the information-theoretic capacity of the reverse link in a CDMA system was first addressed in [1]. That work, plus other earlier ideas for multi-user networks [2,3], are surveyed in [4]. These works focus on the set of all capacities based on multi-user detection techniques. More recent works analyze the aggregate reverse link capacity, using matched filters [5,6,7].
A challenge in modeling these systems is to suggest a proper mapping between the signal to noise ratio (SNR) and the throughput. This mapping would be determined by the coding [7], when a sub-optimal coding strategy is used. Nevertheless, the assumption of Shannon capacity is theoretically feasible because of the existence of coding strategies such as Turbo Coding [8].
Here, we first introduce the formal formulation of the problem. Then, different approaches to the problem will be discussed. Assume that M stations are given in a cell, where the i-th station is transmitting at power pi Î [0,pmax]. The path gain from this station to the base equals gi and we assume that g1 ³ ¼ ³ gM. Now, the i-th station's SNR is modeled as,
gi= pigi

I+ M
å
j=1, j ¹ i 
pjgj
.
(1)
Note that, here, we are looking at the chip level and thus the signal to interference ratio (SIR) is equal to the SNR.
Using the Shannon theorem, the relative capacity of the i-th station is well approximated as [4],
Ci=log2(1+gi).
(2)
This capacity is called relative, because we have ignored the fixed transmission bandwidth, B. Now, the problem is to maximize,
C= M
å
i=1 
Ci.
(3)
To make the system practically applicable, the aggregate power received by the base station must be below a preselected value,
M
å
i=1 
pigi £ Pmax.
(4)
Also, it is necessary to have a minimum guaranteed bound on the SNR of the single stations, gi ³ g. This formulation is adopted from [8] and will be called the classical single-cell (CSC) problem.
Oh and Soong worked on CSC and showed that rather than searching for the solution in [0,pmax]M, the search can be conducted in a set of M one-dimensional sub-spaces [8]. For that, they utilized a numerical search. This problem was revisited in [9] using a more general framework. There, the authors proved that the actual search space can be further limited to a set of less than 2M points, for which closed forms were given. The proposed algorithm was then shown to demand O(M2) flops, more than nine times less than the previous approach.
Analysis of CSC reveals that almost always there is one station in the cell which transmits at a capacity about fifty times as mush as the others [6,7,10]. To deal with this unfair behavior, and using the mathematical approach introduced in [9], a maximum capacity constraint, as Ci £ h, is added to the problem, resulting in the new single-cell (NSC) problem [10]. The algorithm proposed in [10] solves the NSC for a M-station cell in O(M3) flops. The essential structure of the NSC algorithm is similar to that of the CSC, except for the fact that the definition of the intervals and the structure of the solution are different in the two cases.
In order to enhance the results of NSC, a new constraint was added to the problem, resulting in N+SC [11]. This was carried out by defining the capacity share of the i-th station as [C\tilde]i=Ci/C and then adding the inequality [C\tilde]i £ (Mm)-1 to the constraints. It was shown that the solution to N+SC either comes from a NSC or from a different version of it, called N¢SC. In either case, the algorithm works in known boundaries and checks at most M(M-1) possible solutions. N+SC, which demands O(M3) flops, uses an approximation for [C\tilde]i.
In this paper, we propose a new set of approximations to simplify the three problems. This simplification results in simpler proofs for the theorems presented in [9,10,11]. Also, we show that these approximations enable us to reduce the computational cost of each algorithm by one in powers of M. Using the superscript a for the new algorithms, we propose algorithms CSCa, NSCa, and N+SCa, for solving the problems CSC, NSC, and N+SC in O(M), O(M2), and O(M2), respectively.

2  Proposed Method

2.1  Mathematical Method

Using the linear transformation,
xi= pigi

I
,
(5)
the goal function reduces to maximizing,
C(
®
x
 
)=
æ
è
1+ M
å
j=1 
xj ö
ø
M
 

M
Õ
i=1 
æ
è
1+ M
å
j=1,j ¹ i 
xj ö
ø
.
(6)
This relationship can be derived by substituting (5) in (1) and the using (2). Similarly, the constraints can be written as,
xi Î [0,li], li= pmaxgi

I
,
(7)

1-2-h=w ³ xi

1+ M
å
j=1 
xj
³ j = g

g+1
, "i,
(8)

M
å
i=1 
xi £ Xmax= Pmax

I
.
(9)
Here, setting w = ¥ and m = 0 gives CSC. Also, setting m = 0 gives NSC and no restriction leads to N+SC.
It is shown that investigating the behavior of the problem in the set of hyperplanes defined as åi=1Mxi=T is beneficiary [9]. In these hyperplanes, the bound for the aggregate transmission power changes into T £ Xmax. Also, the two other constraints add up into,
xi Î é
ë
j(1+T), min
{li,w(1+T)} ù
û
.
(10)
It is proved that [9], if we can limit the search space to xi Î [bi,Bi], where b and Bis are positive values and Bis are sorted in a descending fashion, then the maximum of C([(x)\vec]) occurs when [(x)\vec]=(B1,¼,Bk-1,xk,b,¼,b) for values of k and xk yet to be found. This property is called the boundary theorem and is a result of another theorem which states that the distance between xis should be as large as possible.

2.2  Typical Algorithm

The three algorithms of CSC, NSC, N+SC, and also the internal algorithm N¢SC, have a fairly similar structure. Independent analysis of each problem shows that there is a value of k, or a pair of values j and k, for which the vector [(x)\vec] is linearly calculated based on xk. Then, the problem is to find the best k, or k and j, and then spot the best xk. For each problem, it is independently proved that having fixed k, and also j if applicable, xk should accept either the smallest or the largest value mandated by the boundaries. This way, in each algorithm, the two functions q and Q are derived, both of which depend on k, and j if applicable, and system parameters. Then, the task is to iterate over all values of k, and j if applicable, and to set xk=q and xk=Q and gather all possible results. Then, the best solution is selected.

2.3  Approximation

Except for CSC, we have gi Î [g,2h-1]. To reach to an appropriate approximate form, we note that for nominal values of g = -30dB and h = 0.3, approximating ln(1+gi) with gi carries less than 10% error. Hence, we write,
Ci @ 1

ln2
gi= 1

ln2
é
ê
ê
ê
ë
xi

1+T

1- xi

1+T
ù
ú
ú
ú
û
@
(11)
1

ln2
é
ë
xi

1+T
æ
è
1+ xi

1+T
ö
ø
ù
û
.
Here, the approximation,
log2 æ
è
1+ x

1-x
ö
ø
@ 1

ln2
x(1+x).
(12)
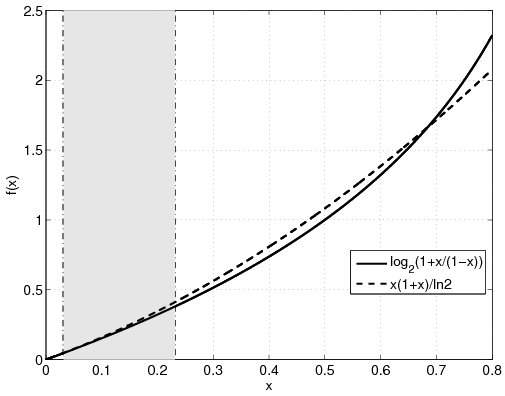
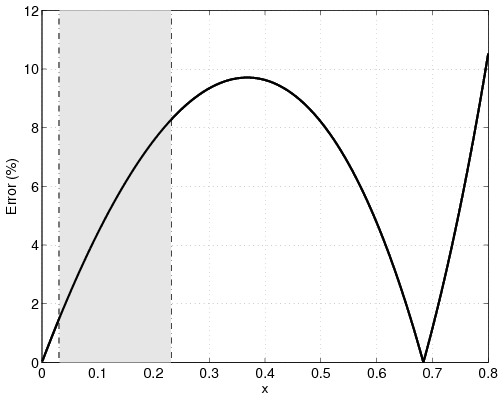
Fig 1-a shows that for the cases of NSC and N+SC, the shaded area is being used, the approximation presented in (12), results in less than 8% error. Also, for these two problems, the actual value is always less than the approximated value. However, for highly impartial CSC solutions, for which x may go over 0.7, the approximation may fall below the actual value. Nevertheless, the error is always less than 10%.
a07-219-1a.pnga07-219-1b.png
(a)(b)
Figure 1: Investigating the properness of the approximation given in (12). (a) The two sides, (b) Relative error. NSC and N+SC work in the shaded area.
Using (11) we have,
C(
®
x
 
) @ 1

ln2
æ
ç
è
1+
M
å
i=1 
xi2

(1+T)2
- 1

1+T
ö
÷
ø
,
(13)
which shows that, for the fixed T, the maximum value of C([(x)\vec]) happens when åi=1Mxi2 is maximum. Assuming that all xis are fixed, except for xj and xk, and that xj+xk=T-åi=1, i Ï {j,k}Mxi=S, the search reduces to maximizing xj2+xk2. Because of 2(xj2+xk2)=(xj+xk)2+(xj-xk)2, the maximum happens when |xj-xk| is maximum. This is identical to the theorem proved in [9].
Note that the approximation given in (13) is also helpful in faster calculation of C([(x)\vec]). As described in Section 2.2, the typical algorithm includes finding bounds for xk for different values of k, and j if applicable, and then finding the aggregate relative capacity at those bounds. Using the approximation given here, the calculations can be performed faster. Hence, if the approximate algorithm does not fail in finding the best k, and j if applicable, the values of p1,¼,pM would be exact.
The actual worry here is that the approximation may deviate the algorithm from finding the best k, or j, and hence may produce a wrong result. Here, we assume that the approximation does not change two values of C for two different sets of pis in a way that the better solution becomes worse. Through experimental analysis it will be empirically shown that the approximate algorithm does give the exact solution, with a negligible probability of erratic behavior. Note that, after pis are found, C will be calculated again, using the exact calculation, in order to yield the exact result.

2.4  Approximate Algorithms

Lemma I: Assume that for given values of a, b and c > 0, the function,
f(x)= x2+ax+b

(x+c)2
,
(14)
is given. For any interval on the positive side, say [q,Q], the maximum value of f(x) in [q,Q] is either f(q) or f(Q).
Proof: The lemma can be proved by analyzing the behavior of f(x) and f¢(x) at teh boundaries \blacksquare
Using this Lemma, the three approximate algorithms are presented below.

2.4.1  CSCa

According to the CSC results, we have [9],
®
x
 
=(l1,¼,lk-1,xk,j(1+T),¼,j(1+T)),
(15)
resulting in,
C(
®
x
 
) @ 1

ln2
×                                                            
(16)
æ
ç
è
y2
xk2- 1

y
xk+L- 1

y
(l+1)

(xk+l+1)2
+1+(M-k)j2 ö
÷
ø
.
Here,
L= k-1
å
i=1 
li2,
(17)

T= xk+l+1

y
,
(18)

l= k-1
å
i=1 
li,
(19)

y = 1-(M-k)j.
(20)
Now, the problem of finding the best xk translates into finding the maximum of f(x), as defined in Lemma I, where,
a=- 1

y
, b=L- l+1

y
, c=l+1.
(21)
Here, the search is performed for all xks which satisfy [9],
xk £ min
ì
ï
ï
í
ï
ï
î
lk,
y min
ì
ï
í
ï
î
Xmax+1,
[1/(j)]lM
ü
ï
ý
ï
þ
-(l+1)
ü
ï
ï
ý
ï
ï
þ
,
(22)

xk ³ j

y-j
(l+1).
(23)
Hence, using Lemma I, xk must accept one of the bounds given in (22) and (23). Using this method, the computational cost of CSCa becomes 36M+6 flops, compared to the 8M2+20M+10-flop cost of CSC [9].

2.4.2  NSCa

Analysis of NSC shows that [10],
®
x
 
=(w(1+T),¼,w(1+T),lj+1,¼,lk-1. xk,
(24)
j(1+T),¼,j(1+T)),
for which,
C(
®
x
 
) @ 1

ln2
æ
è
y2
xk2- 1

y
xk+L- 1

y
(l+1)

(xk+l+1)2
+
(25)
1+(M-k)j2+jw2 ö
ø
.
Here,
L= k-1
å
i=j+1 
li2,
(26)

l= k-1
å
i=j+1 
li,
(27)

T= xk+l+1

y
,
(28)

y = 1-(jw+(M-k)j).
(29)
Now, using Lemma I, xk should accept one of the limits of [10],
xk £ min
ì
ï
ï
ï
ï
í
ï
ï
ï
ï
î
lk,
w

y-w
(L+1), y > w,
y min
ì
ï
í
ï
î
[1/(w)]lj, j ¹ 0,
[1/(j)]lM,
Xmax+1
ü
ï
ý
ï
þ
-(L+1)
ü
ï
ï
ï
ï
ý
ï
ï
ï
ï
þ
,
(30)

xk ³ max
ì
ï
ï
í
ï
ï
î
y

w
lj+1-(L+1),k > j+1,
j

y-j
(L+1)
ü
ï
ï
ý
ï
ï
þ
.
(31)
Here, [P] is one if the condition P holds and zero otherwise. Using the approximate closed form for C([(x)\vec]) given in (25), the computational cost of NSCa reduces to 23M2-21M+14 flops, compared to the [16/3]M3+[55/3]M2-23M+6-flop cost of NSC [10].

2.4.3  N+SCa

To analyze N+SCa, we first have to analyze N¢SCa. In N¢SC we have [11],
®
x
 
= æ
è
1

Mm
T,¼, 1

Mm
T,lj+1,¼,lk-1,xk,
(32)
j(1+T),¼,j(1+T) ö
ø
,
which gives,
C(
®
x
 
) @ 1

ln2
æ
è
                                                    
(33)
y2

(xk+l+a)2
æ
è
xk2- 1

y
æ
è
2j

M2m2
+1 ö
ø
xk+L+
j

M2m2
- 1

y
æ
è
2j

M2m2
+1 ö
ø
(l+a) ö
ø
+1
+(M-k)j2+ j

M2m2
ö
ø
.
Here,
L= k-1
å
i=j+1 
li2,
(34)

l= k-1
å
i=j+1 
li,
(35)

1+T= xk+l+a

y
,
(36)

a = 1- j

Mm
,
(37)

y = 1- æ
è
j

Mm
+(M-k)j ö
ø
.
(38)
Now, using Lemma I, the solution is one of the boundaries given as [11],
xk £ min
ì
ï
ï
ï
ï
í
ï
ï
ï
ï
î
y min
ì
ï
í
ï
î
Xmax+1,
Mmlj+1, j ¹ 0,
[1/(j)]lM
ü
ï
ý
ï
þ
-(L+a),
L+a-y

Mmy-1
, Mmy > 1,
lk
ü
ï
ï
ï
ï
ý
ï
ï
ï
ï
þ
,
(39)

xk ³ max
ì
ï
í
ï
î
y(Mmlj+1+1)-(L+a), k > j+1,
j

y-j
(L+a)
ü
ï
ý
ï
þ
.
(40)
Using (33), the computational cost of N¢SCa reduces from [16/3]M3+[67/3]M2-27M+16 flops to 26M2-23M+15 flops.
Using these results, and also the ones presented in Section 2.4.2, the computational cost of N+SCa becomes 51M2-46M+33 flops. This figure should be compared to the cost of N+SC which is [32/3]M3+[128/3]M2-52M+20 flops [11].

3  Experimental Results

Table 1: Investigating the properness of the approximation. The values in parentheses show relative error. Italic and bold text shows the final results of the exact and approximate algorithms, respectively.

Station #1234567
gi (×10-11) 0.110.0310.00670.00180.00110.000690.00052
pi21.130.964.4516.5125.9643.2057.23
CSCgi3.4300.0100.0100.0100.0100.0100.010
[^p]i0.7740.0100.0100.0100.0100.0100.010
Ci2.1470.0140.0140.0140.0140.0140.014
Cia1.98 (8%)0.01 (0%)0.01 (0%)0.01 (0%)0.01 (0%)0.01 (0%)0.01 (0%)
C=2.233, Ca=2.068 (7%)
pi5.1218.1184.46199.53199.53199.53167.38
NSCgi0.2310.2310.2310.1360.0820.0480.030
[^p]i0.1880.1880.1880.1200.0760.0460.029
Ci0.3000.3000.3000.1840.1140.0680.042
Cia0.32 (7%)0.322 (7%)0.32 (7%)0.19 (5%)0.12 (3%)0.07 (2%)0.04 (1%)
C=1.308, Ca=1.389 (6%)
pi4.5215.9874.50199.53199.53199.53199.53
N+SCgi0.2140.2140.2140.1460.0880.0510.038
[^p]i0.1760.1760.1760.1270.0810.0490.037
Ci0.2800.2800.2800.1970.1220.0720.054
Cia0.299 (7%)0.299 (7%)0.299 (7%)0.207 (5%)0.126 (4%)0.074 (2%)0.055 (2%)
C=1.284, Ca=1.369 (6%)

The proposed algorithms are developed in MATLAB 7.0.4 on a PIV 3.00GHZ personal computer with 1GB of RAM. The parameters used in this study are, g = -40dB, I=-113dBm, Pmax=-106dBm, pmax=23dBm, h = 0.3, m = [1/1.5], and M=7 [12]. Here, we work on a circular cell of radius R=2.5Km. For the station i, at distance di from the base station, we only consider the path-loss, which is calculated as gi=cdin [13]. Here, c=7.75×10⁻³ and n=-3.66 and di is in meters [12]. In the following, the superscript a is used for all variables which are calculated using the approximate forms.
Table 1 investigates the properness of the applied approximation for a system solved in the three frameworks. Note that, as expected, the error in Cia is always less than 10% in all cases. The least error is observed in CSC for those stations which transmit at the minimum capacity. This was predicatble, because based on Fig 1-b, we know that smaller values of [(xi)/(1+T)] undergo smaller errors. Also, note that, as again expected from the discussion given for Equation (12), the approximation is always producing excessive results for NSC and N+SC. Furthermore, as again expected, the approximation is sometimes conservative in the case of CSC, but not always.
Table 2: The case in which approximation distracts the optimization process from finding the best solution.

SolutionStation 1Station 2Station 3Total
kxkx1[^x]1C1C1ax2[^x]2C2C2ax3[^x]3C3C3aCCa
10.010.010.010.010.010.010.010.010.010.010.010.010.010.0430.042
11.551.550.601.311.370.030.010.010.010.030.010.010.011.3371.402
20.031.550.601.311.370.030.010.010.010.030.010.010.011.3371.402
20.921.550.440.840.920.920.260.440.480.040.010.010.011.2961.413
30.041.550.440.840.920.920.260.440.480.040.010.010.011.2961.413
30.201.550.420.790.870.920.250.410.450.200.050.080.081.2891.402

Table 3 shows the results of solving a sample problem with the three algorithms. For each algorithm, first the exact results are shown (E). Then, the raw results of the approximate algorithm are presented (A), followed by the results of finding the exact values using the approximate solutions (A+E). These last ones are the final outputs of the CSCa, NSCa, and N+SCa algorithms. As stated at the end of Section 2.3, as the proposed algorithms find precise values of the boundaries, the value of pia is always identical to the values of pi. However, There exists a chance that the approximation may deviate the optimization process from finding the real maximum, due to the induced errors. In this experiment we did not observe such an event.
In an effort to empirically find the chance of the approximation distracting the optimization process from the optimal point, the three algorithms were executed for ten thousand different position of different number of stations (M Î [1,25]). Doing this experiment, only one erratic incident was found. With M=3, g1=0.39×10⁻¹³, g2=0.23×10⁻¹³, and g3=0.05×10⁻¹³, the approximation made an error in spotting the optimum point in CSCa. This error induced a 3% deviation in the final result. Based on this experiment we can roughly state that there is a less than 0.1% chance for a less than 5% error when the approximation is used. However, note that the error has occured when no maximum bound has been set for Ci. Here, we extensively analyze this case.
Table 2 analyzes this error. The bold number in the C row shows CSC's choice. Similarly, the bold number in Ca row show CSCa's selection. The problem here is that the approximation has changed 1.296 into 1.413, carrying about 8% error. Then, mistakenly, CSCa has rejected the value of 1.227 in delusion of having found a better value. Trying to find the root of this error, we see that C1 and C1a are far apart, carrying more than 9% error. The reason for this error is the high [^x]1 of about 0.44. Looking at Fig 1-b, we see that [^x]1 is on the worst range in respect to the error of the approximation. One way to refrain from these errors is to have smaller [^x]is, which means having more fair systems. In fact, in the case of NSCa and N+SCa, we do have [^x] Î [j,w]=[0.03,0.19], the shaded area in Fig 1. This explains why the only case of erratic behavior observed here has happened in CSCa and not NSCa or N+SCa.

4  Conclusions

Based on the formulation of the reverse link aggregated capacity maximization problem available in the literature, a new approximation for computing the aggregate relative capacity was proposed. As the available algorithms find the aggregate capacity for a large set of candidate points, the approximation is beneficiary in reducing the overall computational cost. After giving mathematical guarantees that the application of the proposed approximation is acceptable within an error range, its actual implementation in the available algorithms is discussed. Also, it is shown that there is a decrease of one in orders of M in the computational costs of the available algorithms when the approximation is being used. Using examples and numerous safety checks, we observe that beyond a negligible probability, the approximation does not lead to false results. Analysis shows that there is a 0.1% possibility that there may be a less than 5% error in the results. Extensive investigation shows that this error happens in the case of the classical formulation of the problem, in which the system is capable of becoming very partial. This way, the approximation is shown to be vulnerable to monopoly of power. Hence, we conclude that, in more controlled environments, in which the share of powers of different stations are in a limited range, the approximation yields precise results while reducing the computational cost by a factor of more than 1/5M, where M is the number of the stations.
#1Investigating the properness of the approximation when embedded into the algorithms. The values in parentheses show relative error. Italic and bold text shows the final results of the exact and approximate algorithms, respectively.
Station #1234567
gi (×10-11) 0.40.00510.00380.00190.00140.00080.00052
pi5.775.907.8516.0221.2837.1957.24
ECi2.1470.0140.0140.0140.0140.0140.014
CSCaC 2.233
pia 5.77 (0%)5.90 (0%)7.85 (0%)16.02 (0%)21.28 (0%)37.19 (0%)57.24 (0%)
ACia1.982 (8%)0.014 (0%)0.014 (0%)0.014 (0%)0.014 (0%)0.014 (0%)0.014 (0%)
Ca 2.068 (8%)
A+ECia*2.147 (0%)0.014 (0%)0.014 (0%)0.014 (0%)0.014 (0%)0.014 (0%)0.014 (0%)
Ca* 2.233 (0%)
pi1.40111.86148.95199.53199.53166.6057.24
ECi0.3000.3000.3000.1900.1410.0650.014
NSCaC 1.310
pia1.40 (0%)111.86 (0%)148.95 (0%)199.53 (0%)199.53 (0%)166.60 (0%)57.24 (0%)
ACia0.322 (7%)0.322 (7%)0.322 (7%)0.200 (5%)0.146 (4%)0.067 (2%)0.014 (0%)
Ca 1.393 (6%)
A+ECia*0.300 (0%)0.300 (0%)0.300 (0%)0.190 (0%)0.141 (0%)0.065 (0%)0.014 (0%)
Ca* 1.310 (0%)
pi1.33106.43141.72199.53199.53199.53164.49
ECi0.2840.2840.2840.1900.1410.0790.042
N+SCaC 1.303
pia1.33 (0%)106.43 (0%)141.72 (0%)199.53 (0%)199.53 (0%)199.53 (0%)164.49 (0%)
ACia0.304 (7%)0.304 (7%)0.304 (7%)0.200 (5%)0.146 (4%)0.081 (2%)0.042 (1%)
Ca 1.303 (0%)
A+ECia*0.284 (0%)0.284 (0%)0.284 (0%)0.190 (0%)0.141 (0%)0.079 (0%)0.042 (0%)
Ca* 1.303 (0%)


File translated from TEX by TTH, version 3.72.
On 14 Nov 2007, 13:49.